Optical Measurement Guidelines for High-Power LEDs and Solid State Lighting Products, Part 2
April 10, 2017
Part 1, published in the March 9 issue of LDS, introduced calibration procedures and practical operating guidelines for integrating spheres that are used for the characterization of LEDs and SSL products. In this second of two parts: guidelines to prevent common equipment errors.
Users sometimes report measurement discrepancies for the same LED when measured on two different systems. This could arise either because of errors with the system or different levels of accuracies between the two systems. This section describes several common sources of equipment errors and provides suggestions to minimize those.
Integrating sphere
Choosing an appropriately sized integrating sphere is important since it will directly impact overall throughput and accuracy of the measurements. Unfortunately, this choice is complicated due to two conflicting requirements:
1. A smaller sphere increases sphere throughput, i.e. the amount of light at the output port divided by the amount of light entering the sphere. A higher throughput, in turn, yields an increased signal-to-noise ratio at the detector.
2. A large sphere enhances spatial integration of light and improves overall system accuracy. It is, therefore, important to strike an appropriate balance between system throughput and accuracy.
Sphere throughput is also a function of the sphere wall reflectance. It is therefore best to use a sphere with a wall reflectance greater than 95% in the visible spectrum.
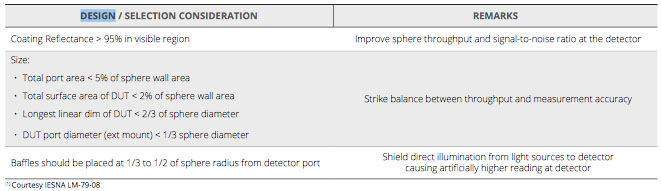
When acquiring a sphere system, it is critical to explain to the vendor key parameters such as DUT dimensions and DUT measurement geometry (4π or 2π configuration) to ensure optimal system performance. Table 1 summarizes several key considerations for sphere design and selection.
Detector
For luminous flux measurements, two types of detectors can be used, a photometer or a spectroradiometer. The choice of detector dictates the level of error associated with the measurement.
Spectroradiometer vs. photometer
A photometer consists of a broadband detector with a photopic filter that resembles the human eye response. The output current of a photometer is proportional to the luminous flux. A spectroradiometer, in contrast, measures the total spectral radiant flux distribution of the light source. CIE color matching functions are then weighed with this distribution (in software) to obtain other optical performance metrics such as luminous flux.
The photopic filter used in a photometer typically resembles the human eye sensitivity curve fairly well. However, there are some deviations, especially in the blue spectral region.
Table 1. Integrating Sphere Design and Selection Considerations
When measuring the luminous flux of an incandescent lamp, these deviations in spectral response may not be very obvious as most of the energy from an incandescent lamp is in the red region and diminishing towards blue. However, if a typical white LED is measured with a photometer, these deviations are magnified as a white LED typically has substantial spectral radiant flux in the blue region. Consequently, the use of a photometer for measurement of white LEDs will cause an error. The best way to avoid this is by using a spectroradiometer. An additional benefit of using a spectroradiometer is the ability to obtain other optical performance metrics such as x-y chromaticity coordinates, dominant wavelength, purity, CCT, CRI, peak wavelength, centroid wavelength, and FWHM.
Spectral resolution
Spectrometer bandpass determines the resolution with which a spectrometer can resolve a spectral radiant flux distribution. A smaller bandpass results in a higher resolution. A relatively broad bandpass can cause artificial “fattening” of the spectral radiant flux distribution of an LED, yielding measurement errors in derived optical parameters such as luminous flux. To minimize this error, the bandpass should be set to approximately 1/5 of the FWHM of the LED; this translates into a bandpass that is not much larger than 3nm for narrow band LEDs.
Stray light
A typical array spectrometer consists of a diffraction grating that splits the incoming light spatially into its spectral components and projects the split components onto a detector array, such that each pixel of the array receives a split light component characterized by wavelength. Stray light is the measured quantity of light that is of a wavelength other than that selected. For example, if a particular pixel in an array normally collects light for 575–576 nm, stray light in that pixel is any light contribution coming from wavelengths other than 575–576 nm.
High levels of stray light in a spectrometer will undermine the calibration accuracy. Therefore, stray light within the spectrometer should be minimized. National Institute of Standards and Technology, USA (NIST) has come up with an algorithm to reduce stray light in spectrometers [8]. Using software that includes this algorithm may reduce stray light effects during calibration.
Reference standards
A measurement system is not complete without appropriate reference lamp standards that are calibrated by an ISO/IEC 17025 certified laboratory. The procedure in the Recommended Calibration Procedure section calls for spectral calibration of the spectroradiometer and absolute luminous flux calibration of the integrating sphere system. Spectral calibration is typically performed with a halogen spectral lamp. If the source to be measured is a broadband incandescent lamp, the spectral calibration standard can be used as an absolute luminous flux calibration standard as well. However, if an integrating sphere is used to measure LEDs (especially white or blue LEDs) the halogen spectral lamp cannot be used as an absolute luminous flux calibration standard because:
1. the stray light in the blue region of the spectroradiometer is higher when calibrated with a tungsten halogen source, which has most of its energy in the infrared region.
2. the signal-to-noise ratio in the blue region for a tungsten halogen source is poor.
Therefore, Lumileds recommends using a calibrated LED source as an absolute luminous flux calibration standard to ensure accurate luminous flux measurements for LEDs and SSL products.
Current sources
Integrating sphere measurements are normally collected with monopulse or continuous DC input drive currents. In monopulse mode, the DUT is briefly subjected to a constant current pulse with a typical duration of 20–50ms, while the spectrometer integration time is set slightly shorter than the duration of the current pulse. In continuous DC mode, the DUT is subjected to a constant current and the integration time is automatically selected to get the best signal to noise ratio.
The spectral radiant flux distribution of a broadband light source is a function of the current through the lamp. Hence the current must be well controlled to a value within an acceptable tolerance (e.g., ±0.1mA) to ensure relative stability and reproducibility of the light source standard. In case of LEDs, the spectral radiant flux distribution is very sensitive to fluctuations in the drive current and temperature. So it is imperative that the current source used to power the absolute calibration LED standard and the DUT is stable and accurate, and that the LED has reached a steady state temperature.
Handling guidelines for the device under test
Although equipment-based errors can be minimized by adopting the best practices discussed in the previous section, measurement discrepancies for the same LED between two different systems may persist. For example, a customer may measure an LED in a properly calibrated integrating sphere system and still report a different luminous flux value than the luminous flux reported by the vendor of that LED. This section discusses possible sources of such discrepancies and measures to minimize those.
Unequal operating conditions
The luminous flux of an LED is a strong function of drive current and junction temperature. Unequal operating conditions when comparing two measurements, is one of the biggest sources of discrepancy and should be checked first before proceeding with further troubleshooting. The calibration status of the test equipment as well as any differences in ambient temperature and/or DUT positioning in the sphere can affect measurement accuracy. So Lumileds recommends documenting the following pieces of information with each measurement:
• ambient temperature and humidity
• LED drive conditions (socket temperature, type of current pulse, current duration and amplitude)
• location of the LED and its mechanical fixture in the integrating sphere
• date of last calibration
Inconsistent DUT positioning
LEDs are typically kept in place by a mechanical fixture, which, in turn, is mounted on a port of the integrating sphere or is positioned in the center of the sphere.
Inconsistencies in the relative placement of DUTs in two integrating spheres are a common source of measurement discrepancies.
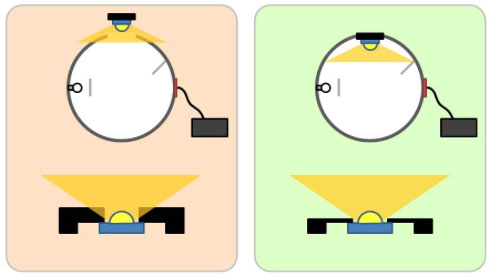
When the DUT is mounted onto a sphere port, the mechanical fixture should not obstruct any of the light from the DUT, i.e. all light from the DUT should be captured inside the sphere (see figure below). In addition, if the DUT is tested in a sphere with a 4π configuration, the center of the DUT emitting area should be placed at the center of the sphere, facing away from the detector.
An ideal sphere system is designed such that baffles shield the detector from direct illumination by the DUT. The baffle size and position is optimized to ensure maximum light integration and proper light shielding at the same time. The appropriate position of a baffle in an integrating sphere depends on where the DUT is normally mounted. The baffle position for a DUT mounted in the center is typically different than the baffle position for a DUT mounted at a port. In case the DUT can be mounted either on a port or in the center of the sphere, two separate baffles must be positioned inside the sphere. In case a DUT is placed off-center inside a sphere, the detector is likely to see direct light instead of spatially integrated light, causing skewed readings.
Near field absorption
Sometimes a portion of the total light emitted from a DUT gets lost due to the presence of a high absorbance material near the DUT. As a result, the measurement system records a reduced value for the luminous flux. This near-field absorption can occur due to LED sockets, Printed Circuit Boards (PCBs) or mechanical mounting brackets. It is nearly impossible to correct for this type of absorption with an auxiliary lamp. However, this can be minimized by either selecting a low absorbance material or by painting that material with a high reflectance coating.
Level 1 to Level 2 measurement differences
A single LED package, which is not mounted on any board or heat sink, is often referred to as a Level 1 solution. A Level 2 solution, on the other hand, typically refers to one or more LEDs mounted in an array on a PCB with several contact points for electrical power.
LEDs that are placed in close proximity to each other, such as in a Level 2 solution, can sometimes absorb some of the light from their neighbors, reducing the overall luminous flux of the array. Therefore, the measured flux of a Level 2 solution is not always equal to the combined flux of the individual LEDs on the Level 2 solution.
However, this effect is often difficult to estimate in advance since the LED package type, the dome size, the distance between devices as well as the absorption properties of the PCB on which the LEDs are mounted can all adversely affect the total luminous flux of the Level 2 solution.
Read Part 1, Optical Measurement Guidelines for High-Power LEDs and Solid State Lighting Products, here: http://lighting.electricalindustry.ca/led-technology/1734-optical-measurement-guidelines-for-high-power-leds-and-solid-state-lighting-products-part-1
“Optical Measurement Guidelines for High-Power LEDs and Solid State Lighting Products” was first published as a white paper by Lumileds: http://www.lumileds.com/uploads/377/WP17-pdf.